AI Analysis Details Table
AI Analysis Details Table
#380640
Use the AI Analysis Details report to review instance-specific details. The content of the report is defined by your selection in the tree viewer. You can further filter the table content using the options on the column headers and from a flyout menu. See Using Filters.
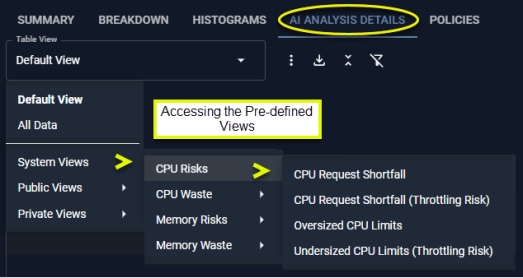
Pre-Configured Views
The following pre-configured tables are provided to quickly show various issues in your environment. Specific filters have been set and selected columns are displayed to highlight the specified risk or waste issue.
Figure: Accessing the System Views on the AI Analysis Details Tab
The content of the table as well as the totals at the bottom reflect applied filter settings. Not all columns may be displayed in your view, but you can add them at any time. See Using Table Column Features.
|
System View |
View |
Description |
|---|---|---|
|
Default View |
N/A |
This is the most commonly used set of columns that provide a summary view of your containers. Significant wasted spend is highlighted. The "Total Waste" is pinned to the left side of the table and the table is sorted on this column in descending order. |
|
All Data |
N/A |
All columns are displayed. All filters are cleared. Horizontal and vertical scroll bars are displayed so you can navigate the content of the table. |
|
CPU Risks |
CPU Request Shortfall |
This view highlights containers with a shortfall of CPU resources. |
|
CPU Request Shortfall |
This view highlights containers with unspecified with CPU request values. |
|
|
CPU Request Shortfall |
This view highlights containers with a shortfall of CPU resources. |
|
|
Oversized CPU Limits |
This view highlights containers with surplus CPU resources. |
|
|
Undersized CPU Limits |
This view highlights containers that are sized incorrectly and are under CPU pressure. You can identify containers at risk and adjust their CPU allocation to prevent performance issue. |
|
|
CPU Waste |
CPU Request Surplus |
This view highlights containers identified with surplus CPU request settings. |
|
Immediate CPU Savings |
This view highlights immediate savings that can be achieved by adjusting the CPU Request settings only for containers within Node Groups where the "CPU Request" is the primary constraint. |
|
|
Additional CPU Waste |
This table highlights possible, additional savings that can be achieved. |
|
|
Memory Risks |
Memory Request Shortfall |
This view highlights containers that are under-provisioned for memory |
|
Memory Request Shortfall |
This view highlights containers with unspecified with memory request values. |
|
|
Memory Request Shortfall |
This view highlights containers that are severely under-provisioned for memory possibly leading to out of memory errors and containers stopping. |
|
|
Oversized Memory Limits |
||
|
Undersized Memory Limits |
This view highlights containers that are sized incorrectly and are under memory pressure. You can identify containers at risk and adjust their memory allocation to prevent service failures. |
|
|
Memory Limit Events |
This view highlights containers that have already experienced out of memory events. |
|
|
Restarts |
This view highlights containers that have already experienced out of restarts, due to memory issues. |
|
|
Memory Waste |
Memory Request Surplus |
This view highlights containers identified with surplus memory request settings. |
|
Immediate Memory Savings |
This view highlights immediate savings that can be achieved by adjusting the Memory Request settings only for containers within Node Groups where the "Memory Request" is the primary constraint. |
|
|
Additional Memory Waste |
This view highlights possible, additional savings that can be achieved. |
|
|
GPU |
Inventory |
This view highlights containers with GPU request values. |
|
GPU Cost |
This view includes the columns with the added cost of the GPU. |
|
|
GPU - Low Utilization |
This table highlights containers that have under-utilized GPU resources. |
|
|
GPU Memory - Low Utilization |
This table highlights containers that have under-utilized GPU memory resources. |
Container Details
|
Column Name |
Description |
|---|---|
|
Cluster |
The parent cluster containing the pods. |
|
Entity ID |
A unique identifier, assigned by Densify. |
|
Node Group |
The name of any node groups contained in this cluster. If the cluster contains multiple node groups, all node groups are listed. For nodes that do not belong to a node group, the node group value will be <cluster-name>-default”. |
|
Namespace |
The namespace associated with the container. This allows you to logically group your pods. |
|
Pod Owner Kind |
The controller type that monitors and maintains the state of your cluster. This can be one of DaemonSet, Deployment, ReplicaSet, ReplicationController, StatefulSet, etc. |
|
This is the average number of containers specified by the selected manifest. The number is determined using an average number of containers, based on the metric, "In Service Instances". This value is used to calculate surplus resources and savings/waste. The total number of containers, listed at the bottom of each column is based on your selection in the tree viewer and on any filters that have been applied. |
|
|
Pod Owner Name |
This is the name of the controller or pod. You can have one or more containers per pod. |
|
This is the name of the container manifest. The container name is a hyperlink that opens a modal view of the Overview tab. When you export the content of this table, a URL is provided in the last column, "Container Details URL". When you open the exported .XLS file, the content initially appears as plain text and then when you click on the cell it becomes a hyperlink that takes you to the Overview tab for the selected container. See Using Deep Linksfor details. |
|
|
Policy |
This is the name of policy used to analyze this container's utilization data. Click the link to open a flyout summary of the policy settings. Contact [email protected] for details on configuring policy settings. |
|
CPU Request (mCores) Memory Request (MB) CPU Limit (mCores) Memory Limit (MB) |
The current request and limit CPU | memory values for the selected container are displayed in these 4 columns. The total, listed at the bottom of the Request and Limit columns for both CPU and Memory, is calculated as (current value * No. of Containers). This formula is also used for CPU Limit and Memory Limit. For containers where the current CPU value is unspecified a dash (-) is displayed in the main table and '0' is displayed in the "Total" row. |
|
Recom. CPU Request (mCores) Recom. Memory Request (MB) Recom. CPU Limit (mCores) Recom. Memory Limit (MB) |
The recommended request and limit CPU | memory values for this container are displayed in these columns. The total, listed at the bottom of the Request and Limit columns for both CPU and Memory, is calculated as (Current CPU Request * Current Count). This formula is also used for CPU Limit and Memory Limit. These columns are hidden by default. You can enable it for display, as required. See Data Controls, above. |
|
Surplus CPU Limit (mCores) Surplus Memory Limit (MB) |
The surplus is the difference between the current and the recommended values. If the current value is unspecified, then the surplus value will be negative (i.e. 0 - recommended value). |
|
CPU Peak (mCores) Memory Peak (MB) |
The highest peak value in mCores or MB, on the busiest container. Currently, this peak value is the 5-min average value and not the maximum within the 5-minute interval. These data points allow you to find containers where the CPU and memory requests are higher than peak utilization over a given period. You can use these raw peak numbers to compare with the CPU or memory surplus request values. For example, if CPU Request = 500 mCores; Peak CPU utilization in the last 95 days is only 45 mCores, then this indicates there is significant waste. |
|
CPU Sustained (mCores) Memory Sustained (MB) |
The sustained value in mCores or MB, on the average container. |
|
CPU Min (mCores) Memory Min (MB) |
The minimum value in mCores or MB, on the average container. |
|
% CPU Request vs Required |
This is the percentage of requested CPU as a percentage to the number of CPUs that are required. |
|
% CPU Limit vs Required |
This is the percentage of CPU resources allocated to limits as a percentage of the reuired CPU limit value. |
|
% Memory Request vs Required |
This is the percentage of requested memory as a percentage to the amount of memory that is required. |
|
% Memory Limit vs Required |
This is the percentage of memory resources allocated to limits as a percentage to the memory limit value required. |
|
This is the total CPU request value for the container and is calculated as (current value * No. of Containers). |
|
|
Total CPU Request Surplus from Unspecified (mCores) |
The selected manifest does not specify a total CPU request value, so the displayed value is based on Densify's recommended setting. Unspecified requests are treated as 0 for this calculation, so a "surplus" appears as a negative value, indicating that the recommended CPU request is greater than zero. This value is indicated as a shortfall on the Overview tab. See 1 for more details. |
|
This is the total surplus CPU request value for the container and is calculated as: (Current CPU Request - Recommended CPU Request) * Uptime% * No. of Containers. |
|
|
This is the total memory request value for the container. Calculated as: (current value * No. of Containers). For containers where the current CPU value is unspecified "0" is displayed in this column. |
|
|
Total Memory Request Surplus from Unspecified (MB) |
The selected manifest does not specify a total memory request value, so the displayed value is based on Densify's recommended setting. Unspecified requests are treated as 0, so a "surplus" appears as a negative value, indicating that the recommended memory request is greater than zero. This value is indicated as a shortfall on the Overview tab. See 1 for more details. |
|
This is the total surplus memory request value for the container. Calculated as: (Current Memory Request - Recommended Memory Request) * Uptime% * No. of Containers. For containers where the current CPU value is unspecified "0" is displayed in this column. |
|
|
Uptime % |
Uptime % is the total time the container has been running as a percentage of the total hours since the container was deployed. (Running Hrs/Total Hrs) When using pay-per-use pricing models, the amount of time each instance has been running, is required to accurately estimate future costs. The predicted uptime (%) for a cloud instance or container, is based on the percentage of hours CPU utilization data is present in the historical interval, as specified in the policy settings for the entity. For Auto Scaling groups and VM Scale Sets and Individual child instances are not taken into account. Uptime for new instances or containers, that started mid-way through the historical interval, is calculated from the time/date that the instance was started rather than the beginning of the interval, resulting in more accurate predictions for future usage. For example, the uptime is the number of hours that have "CPU Utilization in mcores", and the range is the lesser of when the container was discovered, or the range that is defined in the policy. Looking at a specific container that was discovered on July 5th 2025, that has workload for 42 hours since that date, then 13 days later, the uptime % is 42 hrs/(13 days x 24 hrs/day) = 13.4%. This is the value reported in this column. |
|
Total Hrs |
The total hours are determined by calculating the duration from the time the first container, as defined by the manifest, starts, until the point that Densify analyzes the specified containers. Total hours continues to increment until the manifest is no longer discovered by Densify. |
|
Running Hrs |
Running hours is the number of hours of CPU utilization data from any running containers, as defined by the container manifest. The number of running containers is not used when determining the number of running hours. i.e. 3 containers are running from 2pm to 6pm, then “Running Hours” will be 4 hrs. |
|
Restarts - Last Day |
The total number of restarts of all containers associated with the deployment, in the last day. A dash (-) is displayed if no data has been collected. |
|
Memory Limit Event - Last Day |
Indicates if the peak working set memory utilization was near or exceeded the memory limit, in the last day. If memory events have been encountered (value=Yes) then the table cell is shaded to clearly indicate this container is at risk. A value of "No" indicates:
|
|
Optimization Type |
Identifies the overall result of the optimization analysis. Values are colour-coded and the possible colours are listed in Container Optimization Types, below. |
|
Cost per Container ($/month) |
This is the cost to run this container. The value is calculated as follows: ((Current CPU Request/1000) * CPU unit cost + (Current Memory Request/1024) * Memory unit cost) * Uptime% |
|
Waste per Container ($/month) |
This is the amount of money that can be saved by running this container, in the recommended configuration. The value is calculated as follows: (((Current CPU Request - Recommended CPU Request)/1000) * CPU unit cost + ((Current Memory Request - Recommended Memory Request)/1024) * Memory unit cost) * Uptime% |
|
Total Cost ($/month) |
The total cost for the containers in the selected scope. Calculated as Cost per Container * No. of Containers. |
|
Immediate CPU Savings ($/month) |
Immediate (Realizable) CPU savings can be achieved by optimizing specific CPU settings. You can reduce costs, by adjusting the CPU Request settings, only for containers within NodeGroups where "CPU Request" is the primary constraint. A container qualifies for immediate savings if the "% of Nodes with CPU Saturation" is below a predefined threshold. For example, if the threshold is set at 50%, only containers where "% of Nodes with CPU Saturation" is less than 50% should be considered. Realizable memory savings can be achieved by adjusting the Memory Request settings only for containers within Node Groups where Memory Request" is the primary constraint. Calculated as: (Sum (Total Surplus CPU Request (mCores))” /1000 mCores/Cores) * CPU unit cost. |
|
Additional CPU Waste ($/month) |
The total cost for the containers in the selected scope. Calculated as: (Total Surplus CPU * CPU unit cost) - Immediate CPU Savings |
|
Immediate Memory Savings ($/month) |
Immediate (Realizable) memory savings can be achieved by optimizing specific memory settings. Realizable memory savings can be achieved by adjusting the Memory Request settings, only for containers within Node Groups where Memory Request is the primary constraint. A container qualifies for immediate savings if the "% of Nodes with CPU Saturation" is below a predefined threshold. For example, if the threshold is set at 50%, only containers where "% of Nodes with CPU Saturation" is less than 50% should be considered. Calculated as: (Sum (Total Surplus Memory Request (MB)) /1024 MB/GB) * memory unit cost. |
|
Additional Memory Waste ($/month) |
The total cost for the containers in the selected scope. Calculated as: (Total Surplus Memory * Memory unit cost) - Immediate Memory Savings |
|
Total Realizable Savings ($/month) |
Realizable (Immediate) savings can be achieved by optimizing specific CPU and memory settings. Calculated as: Sum of Immediate CPU Savings + Sum of Immediate Memory Savings |
|
Total Waste ($/month) |
This value indicates the total savings that can be achieved if the recommendations are implemented. Calculated as: (Waste per Container ($/month) * No of Containers |
|
# of Nodes |
This is the number of nodes on which this container has run. You can hover over the cell to see the list of all node name(s) on which the selected container(s) reside(s). |
|
A value in this column indicates the instance type (cloud) or instance request/limit values (container) has been change recently. The workload for this instance, on which the recommendation is based, includes only the days of data from the indicated date to the current date. All historical data for this instance, collected prior to the indicated date is not included in the analysis. Previous data has been excluded because it was based on the previous instance type (cloud) or instance request/limit values (container). A blank cell indicates the current instance type has not changed and all available workload data within the range, defined by the policy, has been used to generate the recommendation. Contact [email protected] to enable this feature. |
|
|
Node Group CPU Saturation |
Indicates whether this container resides on a node with CPU utilization above the saturation threshold (default: 95%), during the past 7 days. The saturation threshold value is configurable. Contact [email protected] for details. |
|
The percentage of nodes with peak CPU utilization above the configurable, saturation threshold (default: 0%) during the past 7 days of history. The value is expressed as a percentage of the total number of nodes. If the value exceeds the threshold it is shaded red. The saturation threshold value is configurable. Contact [email protected] for details. |
|
|
Node Group Memory Saturation |
Indicates whether this container resides on a node with memory utilization above the saturation threshold (default: 95%), during the past 7 days. The saturation threshold value is configurable. Contact [email protected] for details. |
|
% Nodes with Memory Saturation |
The percentage of nodes with memory utilization above the configurable, saturation threshold (default: 0%) during the past 7 days of history. The value is expressed as a percentage of the total number of nodes. Calculated as: Node hours with saturated memory/total node hours. If the value exceeds the threshold the cell is shaded red. The saturation threshold value is configurable. Contact [email protected] for details. |
|
Node Group Primary Constraint |
Indicates the reason that more containers cannot be added to this node group. The following values are evaluated and whichever has the largest value is identified as the primary constraint:
|
|
The totals for each column are shown in bold, at the bottom of the table. This is the total of all the records in the filtered, tabular report. The total, listed at the bottom of the Request and Limit columns for both CPU and Memory, is calculated as (Current CPU Request * Current Count). This formula is also used for CPU Limit, Memory Request and Memory Limit. The total, listed at the bottom of the Surplus columns for both CPU and Memory, is calculated as: (Current - Recommended). If the value of any row is unspecified, then that value is treated as "0" when summing the values for the total. |
GPU Details
The following table outlines the columns populated with GPU data. The reported GPU data reflects raw utilization metrics. While analysis and recommendations are not currently provided, this data can be used to highlight wasted resources.
|
Column Name |
Description |
|---|---|
|
GPU Model |
The GPU model configured on the parent node. |
|
GPU Request (GPUs) |
The GPU request per container as specified in the manifest. |
|
Total GPU Request |
The total GPU request value, determined as the average number of containers multiplied by the GPU request value. |
|
GPU Peak (GPUs) |
The highest GPU peak value, on the busiest container. Currently, this peak value is the 5-min average value and not the maximum within the 5-minute interval. |
|
%GPU Peak |
This is the peak GPU usage, as a percentage of the GPU request value. |
|
GPU Average (GPUs) |
The average GPU utilization for the average number of containers. |
|
% GPU Average |
This is the average GPU usage, as a percentage of the GPU request value. |
|
GPU Sustained (GPUs) |
The sustained GPU utilization for the average number of containers. |
|
GPU Min (GPUs) |
The minimum GPU utilization for the average number of containers. |
|
GPU Memory Request (GB) |
The GPU memory request value specified in the manifest. |
|
Total GPU Memory Request |
The total GPU memory request value, determined as the average number of containers multiplied by the GPU memory request value. |
|
GPU Memory Peak (GB) |
The highest peak value in MB, on the busiest container. Currently, this peak value is the 5-min average value and not the maximum within the 5-minute interval. |
|
%GPU Memory Peak |
This is the peak GPU memory usage, as a percentage of the GPU memory request value. |
|
GPU Memory Average (GB) |
The average GPU memory utilization for the average number of containers. |
|
% GPU Memory Average |
This is the average GPU memory usage, as a percentage of the GPU memory request value. |
|
GPU Memory Sustained (GB) |
The sustained GPU memory utilization for the average number of containers. |
|
GPU Memory Min (GB) |
The minimum GPU memory utilization for the average number of containers. |
|
GPU Power Usage Peak (Watts) |
The highest peak value in watts, on the busiest container. Currently, this peak value is the 5-min average value and not the maximum within the 5-minute interval. |
|
GPU Power Usage Average (Watts) |
The average power usage for the average number of containers. |
|
GPU Power Usage Sustained (Watts) |
The sustained power usage for the average number of containers. |
|
GPU Power Usage Min (Watts) |
The minimum power usage for the average number of containers. |
|
GPU Sharing Strategy |
The method used to allow multiple containers to share a single GPU. Possible values are None, MPS and Time-Slicing. |
|
Total GPU Cost ($/month) |
The total cost of the GPU for the selected manifest. If a container uses multiple GPU models, the average hourly GPU cost is calculated as follows and used here. Container GPU cost = Total GPUs * Avg GPU hourly cost * Uptime |
Containers with Unspecified Settings
Containers with unspecified request values can lead to misleading savings or shortfall results. In Kubex, costs for containers with unspecified CPU and memory request values, are calculated based on the recommended CPU and memory request values.
The resulting values are then used when calculating the following values on the AI Analysis Details tab:
- Cost per container
- Total Cost
- Total Surplus CPU/Mem Request
Values for the actual CPU and Memory Request, as shown in the corresponding columns are still shown as '-' for these containers.
These containers are still reported as unspecified in the histogram charts, so that you are aware of the risk these containers add to your environment.
Container Optimization Types
Container recommendations are categorized into optimization types, which are based on recommended sizing for the CPU Request, CPU Limit, Memory Request, and Memory Limit settings. See the table below for a description of each container optimization type.
|
Optimization Type |
Description |
|---|---|
|
Just Right |
This container manifest or task definition is optimally configured for the workload. There are no resizing recommendations. |
|
Upsize |
Kubex recommends increasing one or more of CPU Request, CPU Limit, Memory Request, or Memory Limit settings. An "Upsize" optimization type has no recommendations to decrease any container CPU or memory request or limit settings. For example, Kubex assigns an "Upsize" optimization type if a container manifest or task definition has the following aggregate optimization recommendations:
|
|
Downsize |
Kubex recommends decreasing one or more of CPU Request, CPU Limit, Memory Request, or Memory Limit settings. A "Downsize" optimization type does not have any size increase recommendations for any request or limit settings. For example, Kubex assigns a "Downsize" optimization types for the following aggregate recommendations:
|
|
Resize |
Kubex recommends resizing at least two of CPU Request, CPU Limit, Memory Request, or Memory Limit settings. For the "Resize" optimization type, there is at least one increase recommendation and at least one decrease recommendation. For example, Kubex assigns a "Resize" optimization type if a container has the following recommendations:
|
|
Size from Unspecified |
Sizing recommendations are made without current CPU Request, CPU Limit, Memory Request, and Memory Limit values. For "Size from Unspecified" optimization type, there is at least one sizing recommendation from an unspecified setting and no decreasing or increasing size recommendations for any container request or limit settings. For example, Kubex assigns a "Size from Unspecified" optimization type if a container has the following recommendations:
|
|
No Data |
There is insufficient data to recommend changes to CPU Request, CPU Limit, Memory Request, or Memory Limit values. |
Utilization Charts
The last section provides utilization charts that show hourly min/max and sustained activity for the selected node group. You can also expand any chart to the modal view and select other metrics for review. See Using the Utilization Charts for details on using these charts to review workload data.